Data structure
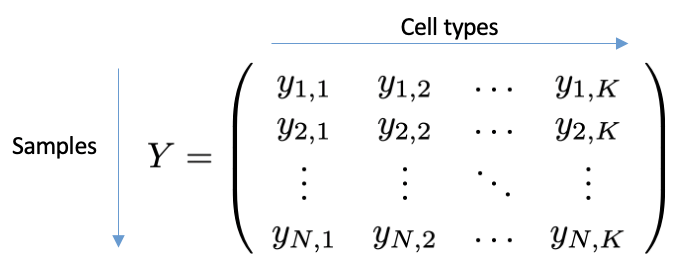

Annotating the cells from a biological sample with individual types, e.g. via clustering methods, and grouping them by cell type, results in a vector of counts (of dimension K), with each entry representing a cell type. A scCODA dataset aggregates N cell count vectors as the rows of a matrix of dimension NxK, the so-called cell count matrix Y. The cell count data does not need to be normalized, as scCODA works on the integer count data. In addition to the cell counts, scCODA also requires covariates that contain information about each sample. These can be indicators for e.g. diseases, or continuous variables, such as age or BMI. The M covariates for an scCODA dataset are described by the (NxM dimensional) covariate matrix X.
scCODA uses the anndata format to store compositional datasets.
Hereby, data.X represents the cell count matrix, and data.obs the covariates (The actual covariate or design matrix is generated when calling a model).
The data.var and data.uns elements are currently not used.

Data generation methods
sccoda.util.data_generation contains methods to generate compositional data with different properties that mimics
the properties of scRNA-seq datasets.
Data import methods
sccoda.util.cell_composition_data contains methods to import count data from various sources into the data structure used by scCODA.
You can either import data directly from a pandas DataFrame via from_pandas, or get the count data from single-cell expression data used in scanpy.
If all cells from all samples are stored in one anndata object, from_scanpy generates a compositional analysis dataset from this.
If there is one anndata object with the single-cell expression data for each sample,
from_scanpy_list (for in-memory data) and from_scanpy_dir (for data stored on disk) can transform the information from these files directly into a compositional analysis dataset.
For more information, see the data import and visualization tutorial.